Network memory and threat detection — one sensor, modular
Trace records the raw traffic on your network so an investigation never depends on a firewall's accept/deny log, detects threats with machine learning and a real, self-hosted AI, and brings the same visibility to OT networks — Modbus, DNP3, IEC 104, OPC UA and the PLCs behind them. Underneath, a live asset inventory built from the wire. One appliance; Analysis, TDS and Assets as modules — and Seraxi Relay for OT.
OT segment · Purdue · Seraxi Relay
L3 → L1 · boundary crossing
TDS event stream
- 13:16:53 HIGH Modbus write · FC16 eng-ws-12 → PLC-07 (S7-1500) · outside change window
- 13:16:41 MED DNS tunnelling host-11 → *.sync-cdn.example · entropy 4.7
- 13:16:22 CRIT C2 beacon 192.168.40.23 → external · TLS 443 · 60s period
- 13:15:58 INFO New OT asset Rockwell CompactLogix · L1 · EtherNet/IP
- 13:15:30 MED Lateral movement SMB admin share · 192.168.12.7 → 3 hosts
Verdict: Unauthorized Modbus write to PLC-07 from an engineering workstation. 3 signals fused: IDS rule (FC16), behavioural ML deviation, Purdue boundary crossing L3→L1.
What it answers
From wire to verdict
You suspect an attack happened last night. Today the only evidence is a firewall log that says accept or deny. Trace changes what you have: Analysis keeps the packets themselves, so you replay the hour or hand the PCAP to incident response. TDS watches the same traffic with static and dynamic ML detection and a self-hosted AI that learns your organisation's own threat model inside a closed network — with global threat intelligence layered on when you want it. Seraxi Relay does the same on the plant floor, speaking industrial protocols natively and mapping assets on the Purdue model.
- We suspect an attack happened last night. What do we actually have?
- The packets. Trace Analysis replays the raw traffic for that hour — not a firewall log that only says accept or deny.
- Is something on the network talking to a domain nobody recognises?
- Trace TDS flags the behaviour on live traffic with ML and a self-hosted AI, and shows the packets behind the verdict.
- A PLC started talking to a workstation it never did before. Is that normal?
- Trace OT knows the Purdue level and the protocol; the deviation is flagged and the raw data is one click away.
- Can we hand evidence to incident response or a regulator?
- Export the exact PCAP for the window in question, with timestamps intact.
Four modules, one appliance
Analysis · TDS · Seraxi Relay · Assets
Analysis, TDS and Assets are modules of the same sensor; Seraxi Relay is the OT product built on it. Start with one; the others switch on without new hardware.
01 — Network memory
Trace Analysis
Full-fidelity capture of your mirrored traffic, indexed and searchable for weeks. When you suspect last night's attack, the only place to look is no longer the firewall's accept/deny log: replay the raw traffic on Trace Analysis, or hand the PCAP to your incident-response team.
- Line-rate capture on SPAN / TAP — lossless, timestamped, indexed
- Replay any minute, weeks later: packets, not summaries
- Export PCAP evidence for IR, legal and regulators
- Raw-data inspection for OT incidents
02 — Threat Detection System
Trace TDS
Static and dynamic detection backed by machine learning and a real, self-hosted AI. TDS learns a threat model that is specific to your organisation, in real time, inside a closed network — and layers Seraxi's global threat intelligence on top when you allow it.
- Behavioural ML over live traffic, tuned to your network
- Static detection: signatures, IOCs, YARA on payloads
- Self-hosted AI analyst — prompts and data never leave the appliance
- Global threat-intelligence feed, optional and air-gap deliverable
03 — OT security · built on Trace
Seraxi Relay
Passive visibility and AI-assisted threat analysis for OT networks, organised by Purdue level. Relay runs on the same sensor, understands industrial protocols natively and identifies PLC, RTU, HMI and SCADA assets from the wire — no agents, no impact on the process. It has its own page because its buyer is the plant, not the SOC.
- Protocols: Modbus/TCP, DNP3, IEC 60870-5-104, IEC 61850 (GOOSE / MMS), OPC UA, PROFINET, EtherNet/IP (CIP), S7comm, BACnet
- Vendors: Siemens, Schneider Electric, Rockwell Automation, ABB, Honeywell, Emerson, Mitsubishi Electric, Omron, GE Vernova, Yokogawa, Phoenix Contact, Beckhoff, Hitachi Energy
- Purdue-model asset map and IT/OT boundary monitoring
- When something critical happens, the raw data is in Trace Analysis
04 — Inventory from the wire
Trace Assets
Every host, service and device that actually talks on the network, discovered passively and enriched from the sources you already run — Active Directory, endpoint management, Infoblox, CMDB. Coverage and compliance views show what is monitored, what is not, and why.
- Passive asset inventory — IT, IoT and OT — with auto-tagging rules
- Discovery & integrations: AD, EDR/endpoint management, Infoblox, CMDB
- Coverage & compliance: which segments and assets are actually monitored
- The same inventory feeds TDS verdicts, OT maps and Analysis searches
How it differs
Trace TDS against cloud-first NDR
Teams evaluate Trace TDS alongside cloud-first network detection platforms. The differences are structural, not feature-list details.
| Trace TDS | Cloud-first NDR | |
|---|---|---|
| Where the AI runs | On your appliance, self-hosted — air-gap included | In the vendor's cloud; sensors ship metadata out |
| What is kept | The packets — full-fidelity capture, exportable PCAP | Metadata and enriched records; packets are usually not retained |
| Threat model | Learned per organisation, in real time, in a closed network — plus optional global intelligence | Vendor-global models; tuning to your estate is limited |
| OT networks | Native industrial protocols and Purdue mapping, same sensor | Separate product or add-on, if at all |
| Investigation | Verdict → packets → PCAP, on one screen | Verdict → ticket; raw evidence lives elsewhere |
| Data sovereignty | Nothing leaves the perimeter unless you export it | Telemetry leaves the country by design |
Characterisation of cloud-first NDR as a category; confirm specifics against each vendor's current documentation.
See it in action
The packets behind every verdict.
Analysis streams flows at line rate onto a searchable timeline; TDS rides alongside with ML classification and anomaly scoring. Ask the network a question in plain language and the self-hosted analyst returns the query, the packets and a correlated verdict — on IT and OT segments alike.
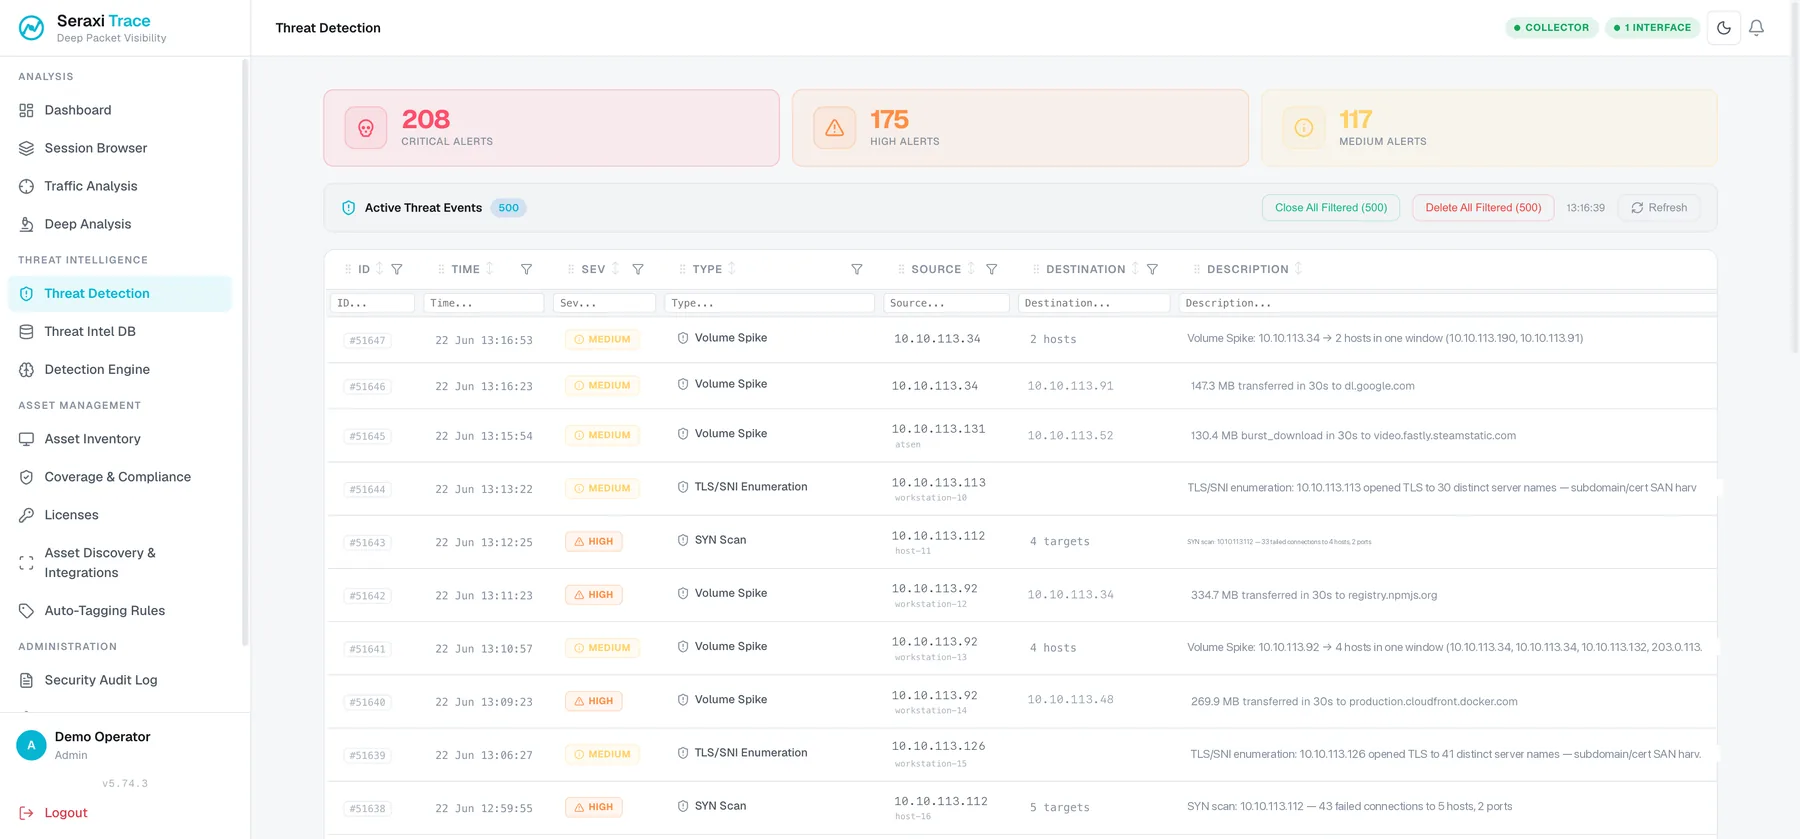
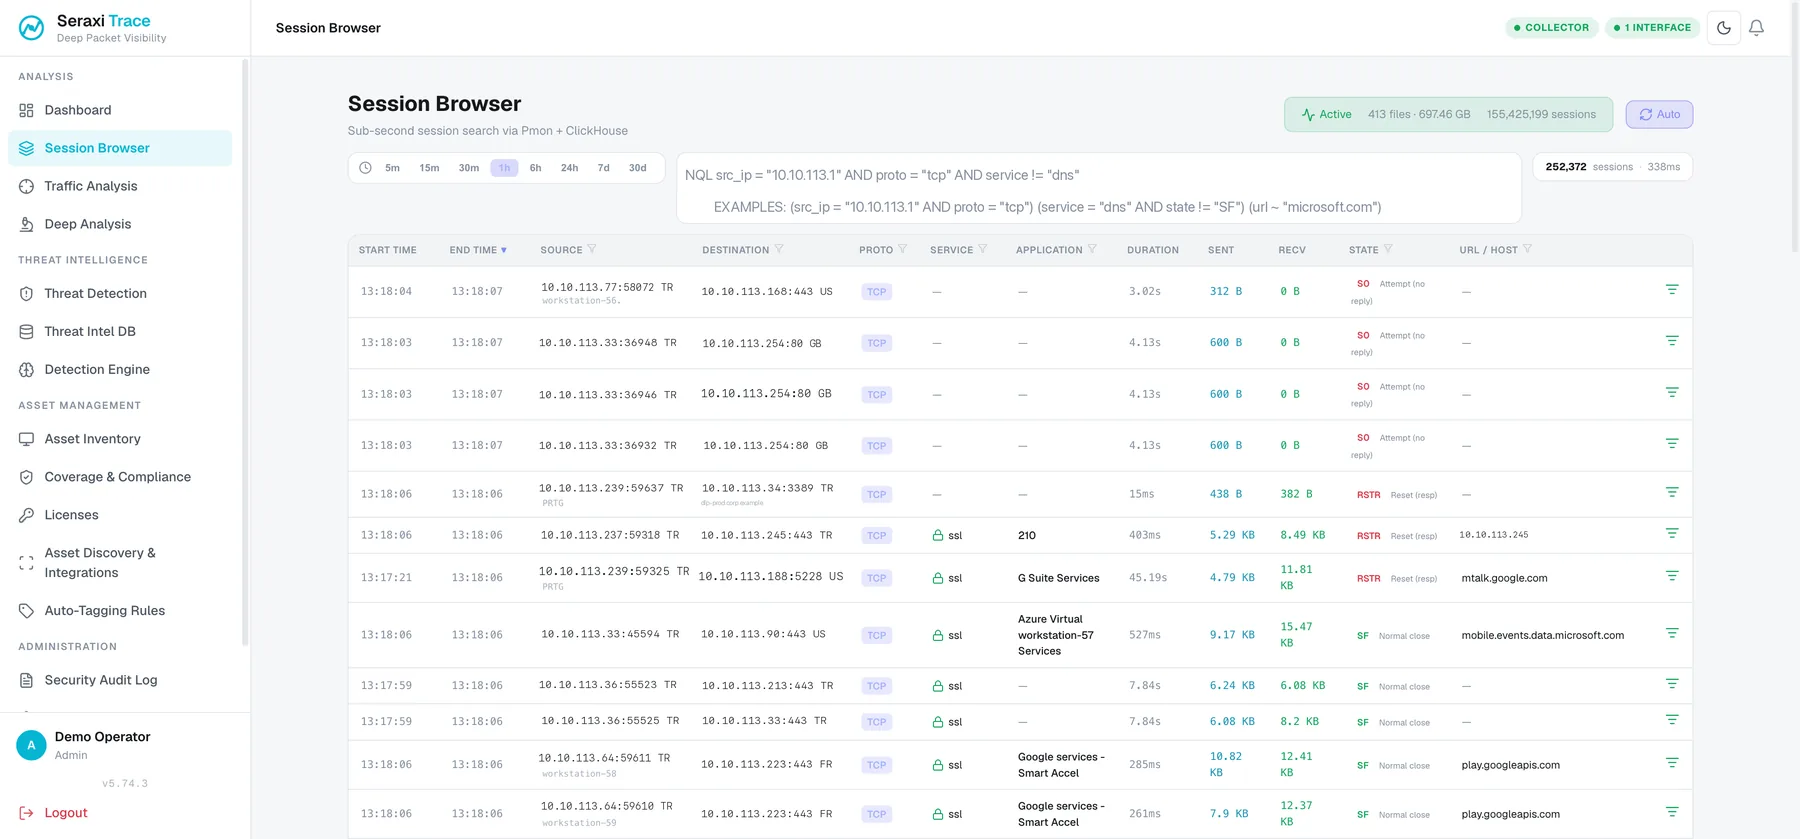
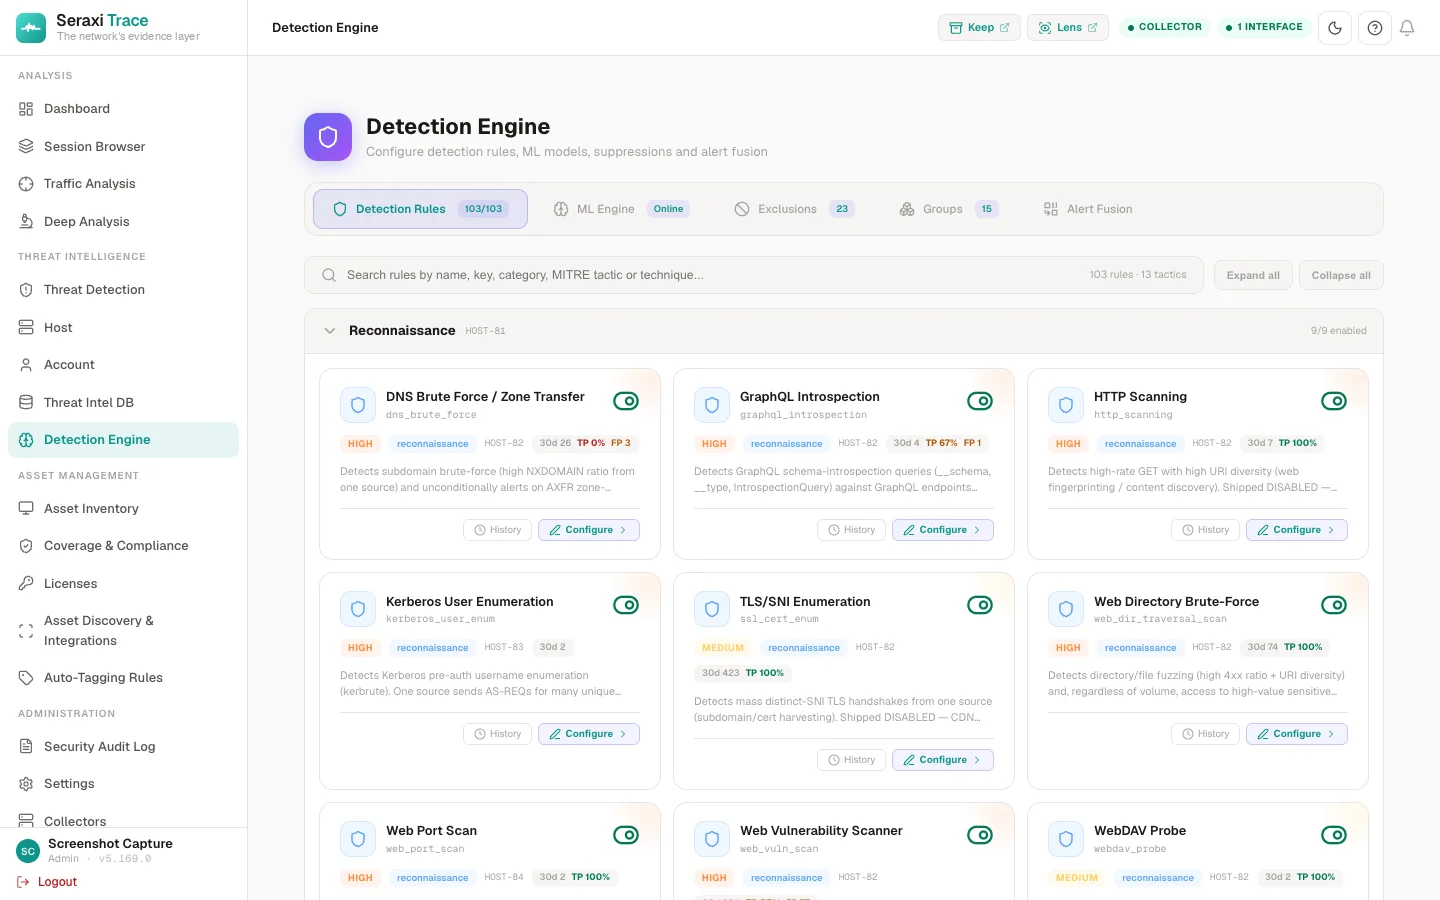
Illustrative data shown. Your deployment runs entirely on your own appliance.
What it does
01
Full-fidelity network memory
Every packet on your SPAN / TAP is recorded at line rate, indexed and searchable — replay the raw wire to the exact minute, weeks after the fact.
02
PCAP hand-off for incident response
Export the exact window as PCAP, timestamps intact, for your IR team, external responders, legal or a regulator.
03
Static + dynamic ML detection
Signatures, IOCs and YARA on payloads, alongside behavioural machine-learning over live traffic that surfaces what static rules never see.
04
Real-time, self-hosted AI
A threat model specific to your organisation, learned inside a closed network by an AI that runs on the appliance — prompts and data never leave.
05
Global threat intelligence
Seraxi's threat-intelligence feed layers onto your local model — online, or delivered offline into air-gapped sites.
06
OT protocols & Purdue map
Modbus, DNP3, IEC 104, IEC 61850, OPC UA, PROFINET, EtherNet/IP and S7comm decoded natively; assets placed on the Purdue model automatically.
07
Asset inventory from the wire
Passive discovery of every host, service and device that talks on the network — IT, IoT and OT — enriched from AD, endpoint management, Infoblox and your CMDB, with coverage and compliance views.
How it works
Trace records the raw wire, detects what matters, and gives you the packets behind every verdict.
- 01
Record
Capture every packet on SPAN / TAP at line rate — lossless, timestamped, indexed, searchable for weeks. IT and OT alike.
- 02
Detect
Static and ML-driven detection runs on the live traffic; a self-hosted AI fuses the signals into verdicts tuned to your organisation.
- 03
Investigate
Replay the exact minute, ask the network questions in plain language, and hand the PCAP to whoever needs the evidence.
Why teams run Trace
- Investigate last night's attack from the packets — not from a firewall log that only says accept or deny.
- Hand incident response, legal or a regulator the exact PCAP for the window in question.
- Detect with static rules and behavioural ML, explained by a real AI that runs on your own hardware.
- Get a threat model specific to your organisation, in a closed network, with global intelligence on top.
- See PLCs, RTUs and SCADA on the Purdue model, with industrial protocols decoded natively.
Live capture
last 24hPart of the Seraxi platform
See Seraxi on your environment.
Book a technical walkthrough. We'll map Trace, Keep, and Lens to your fleet and show you a real backup, capture, and exposure picture — not a slide deck.